Market Outlook
April 13, 2017
Market Cues
Domestic Indices
Chg (%)
(Pts)
(Close)
Indian markets are likely to open flat with a negative bias tracking the SGX Nifty &
BSE Sensex
(0.5)
(145)
29,643
global cues. While the CPI inflation for March came in at 3.81% and below the
Nifty
(0.4)
(34)
9,204
market expectations, the IIP numbers continued to disappointed with a contraction of
1.2% for the month of February.
Mid Cap
(0.2)
(32)
14,347
Small Cap
(0.5)
(73)
14,852
After ending the previous trading session modestly lower the US markets added little
more down side on Wednesday. Reports on retail sales, producer and consumer
Bankex
(0.3)
(65)
24,729
prices and import export prices may attract attention later this week.
The European markets got off with a positive start on Wednesday as the Geopolitical
Global Indices
Chg (%)
(Pts)
(Close)
tension wane. However, concerns over the political situation in France resulted in
Dow Jones
(0.3)
(59)
20,592
some nervousness among investors and traders and the major European indices
Nasdaq
(0.5)
(31)
5,867
ended the day with a mixed note.
FTSE
(0.2)
(17)
7349
The Indian markets continued to remain weak on Wednesday. Investors took a
Nikkei
(1.0)
(195)
18,553
cautious approach ahead of key economic data that was to be released post
Hang Seng
0.9
225
24,314
market. Further direction in the market will be decided by the quarterly earnings
Shanghai Com
(0.5)
(15)
3,274
which start flowing in from this week. In another key development the Govt released
the report submiited by FRBM panel which recommends a fiscal deficit of 3% for
FY18-20 and 2.5 by FY23.
Advances / Declines
BSE
NSE
Advances
1,144
590
News Analysis
Declines
1,756
1090
Result Preview: Infosys
Unchanged
136
61
Detailed analysis on Pg2
Investor’s Ready Reckoner
Volumes (` Cr)
Key Domestic & Global Indicators
BSE
4,129
Stock Watch: Latest investment recommendations on 150+ stocks
NSE
25,902
Refer Pg5 onwards
Net Inflows (` Cr)
Net
Mtd
Ytd
Top Picks
CMP
Target
Upside
FII
(580)
34
44,255
Company
Sector
Rating
(`)
(`)
(%)
MFs
701
2278
11,716
Blue Star
Capital Goods
Accumulate
668
760
13.8
Dewan Housing Fin. Financials
Buy
388
460
18.6
Mahindra Lifespace
Real Estate
Buy
400
522
30.5
Top Gainers
Price (`)
Chg (%)
Navkar Corporation Others
Buy
204
265
30.2
Polaris
196
10.2
KEI Industries
Capital Goods
Accumulate
196
207
5.6
Ibrealest
98
7.8
More Top Picks on Pg3
Repcohome
739
5.7
Key Upcoming Events
Eidparry
291
4.8
Previous
Consensus
Date
Region
Event Description
Mrpl
118
4.5
Reading
Expectations
Apr 13, 2017 US
Initial Jobless claims
234.00
245.00
Apr 13, 2017 US
Producer Price Index (mom)
0.10
--
Top Losers
Price (`)
Chg (%)
Apr 13, 2017 India
Imports YoY %
21.76
--
Adanitrans
76
(9.7)
Apr 13, 2017 India
Exports YoY %
17.48
--
Adanipower
34
(9.0)
Apr 13, 2017 China
Exports YoY %
-1.3
4.3
Deltacorp
169
(6.6)
Apr 14, 2017 US
Consumer price index (MoM)
0.1
0.0
More Events on Pg4
Adanient
114
(5.4)
Rdel
65
(5.2)
As on April 12, 2017
Market Outlook
April 13, 2017
Result Preview
Infosys (CMP: `969/ TP: `1,249 / Upside: 28.9%)
Infosys is slated to announce its 4QFY2017 results today. We expect the company
to post revenue of US$2,589mn with 1.5% qoq growth, mostly volume led. In
rupee terms, revenues are expected to de-grow by 0.2% qoq to `17,244cr, lead
by rupee appreciation. EBITDA margin is expected to dip by ~47bp qoq to 27.1%,
EBIT, on other hand, is expected to come in at 24.6%, a dip of 47bps qoq. PAT is
expected to be at `3,560cr, down 4.0% qoq sequentially. The main factor to watch
out is the FY2018 outlook. We maintain our buy rating with target price of `1,249.
Y/E
Sales OPM
PAT EPS ROE P/E P/BV EV/EBITDA EV/Sales
March
(` cr)
(%)
(` cr)
(`)
(%)
(x)
(x)
(x)
(x)
FY2017E
68,350
27.0
14,354
62.5
21.3
15.5
3.3
10.0
2.7
FY2018E
77,236
27.0
15,928
69.4
21.6
14.0
3.0
8.6
2.3
Economic and Political News
Petrol & diesel prices to change every day from May 1
The cabinet committee approved the listing of 11 public sector enterprises in
the equity markets
Higher fuel prices drives up March CPI inflation to 3.81%
IIP contracts 1.2% in February on weakness in consumer and capital goods
Corporate News
Airtel seeks trai intervention on Reliance Jio Dhan Dhana Dhan offer
Reliance industries starts CBM gas production from two blocks in Madhya
Pradesh
Mahindra Life space launches rights issue to raise `300cr
Quarterly Bloomberg Brokers Consensus Estimate
Infosys Ltd - April 13, 2017
Particulars ( ` cr)
4QFY17E
4QFY16
y-o-y (%)
3QFY17
q-o-q (%)
Net sales
17,261
16,550
4.3
17,273
(0.1)
EBITDA
4,731
4,565
3.6
4,767
(0.8)
EBITDA margin (%)
27.4
27.6
27.6
Net profit
3,559
3,597
(1.1)
3,708
(4.0)
Reliance Power Ltd - April 13, 2017
Particulars ( ` cr)
4QFY17E
4QFY16
y-o-y (%)
3QFY17
q-o-q (%)
Net sales
2642
2,605
1.4
2,778
(4.9)
EBITDA
1237
1,241
(0.3)
1,155
7.1
EBITDA margin (%)
46.8
47.6
41.6
Net profit
313
320
(2.2)
276
13.4
Market Outlook
April 13, 2017
Top Picks ★★★★★
Market Cap
CMP
Target
Upside
Company
Rationale
(` Cr)
(`)
(`)
(%)
Strong growth in domestic business due to its leadership in
Alkem Laboratories
25,549
2,137
2,257
5.6
acute therapeutic segment. Alkem expects to launch more
products in USA, which bodes for its international business.
We expect the company would report strong profitability
Asian Granito
1,134
377
405
7.4
owing to better product mix, higher B2C sales and
amalgamation synergy..
Among the top 4 players in the consumer durables segment.
Bajaj Electricals
3,549
350
395
12.9
Improved profitability backed by turn around in E&P segment.
Strong order book lends earnings visibility.
Favourable outlook for the AC industry to augur well for
Cooling products business which is out pacing the market
Blue Star
6,380
668
760
13.8
growth. EMPPAC division's profitability to improve once
operating environment turns around..
With a focus on the low and medium income (LMI) consumer
Dewan Housing Finance
12,149
388
460
18.6
segment, the company has increased its presence in tier-II &
III cities where the growth opportunity is immense.
Strong loan growth backed by diversified loan portfolio and
Equitas Holdings
5,577
165
235
42.4
adequate CAR. ROE & ROA likely to remain decent as risk of
dilution remains low. Attractive valuations considering growth.
Economic recovery to have favourable impact on advertising
& circulation revenue growth. Further, the acquisition of a
Jagran Prakashan
6,446
194
225
16.0
radio business (Radio City) would also boost the company's
revenue growth.
High order book execution in EPC segment, rising B2C sales
KEI Industries
1,524
196
207
5.6
and higher exports to boost the revenues and profitability
Speedier execution and speedier sales, strong revenue visibilty
Mahindra Lifespace
1,758
400
522
30.5
in short-to-long run, attractive valuations
Higher growth in domestic branded sales and healthy export
Mirza International
1,032
86
107
24.4
to boost the profitability.
Massive capacity expansion along with rail advantage at ICD
Navkar Corporation
2,902
204
265
30.2
as well CFS augurs well for the company
Strong brands and distribution network would boost growth
Siyaram Silk Mills
1,567
1,672
1,872
12.0
going ahead. Stock currently trades at an inexpensive
valuation.
Market leadership in Hindi news genre and no. 2 viewership
ranking in English news genre, exit from the radio business,
TV Today Network
1,680
282
344
22.0
and anticipated growth in ad spends by corporates to benefit
the stock.
Source: Company, Angel Research
Market Outlook
April 13, 2017
Key Upcoming Events
Global economic events release calendar
Bloomberg Data
Date
Time
Country
Event Description
Unit
Period
Last Reported
Estimated
Apr 13, 2017
6:00 PM
US
Initial Jobless claims
Thousands
Apr 8
234.00
245.00
US
Producer Price Index (mom)
% Change
Mar
0.10
India
Imports YoY%
% Change
Mar
21.76
India
Exports YoY%
% Change
Mar
17.48
China
Exports YoY%
% Change
Mar
-1.30
4.30
Apr 14, 2017
6:00 PM
US
Consumer price index (mom)
% Change
Mar
0.10
0.00
Apr 17, 2017
12:00 PM
India
Monthly Wholesale Prices YoY%
% Change
Mar
6.55
6.00
7:30 AM
China
Industrial Production (YoY)
% Change
Mar
6.00
6.30
7:30 AM
China
Real GDP (YoY)
% Change
1Q
6.80
6.80
Apr 18, 2017
6:00 PM
US
Housing Starts
Thousands
Mar
1288.00
1260.00
6:00 PM
US
Building permits
Thousands
Mar
1216.00
1258.00
6:45 PM
US
Industrial Production
%
Mar
0.11
0.50
Apr 19, 2017
2:30 PM
Euro Zone
Euro-Zone CPI (YoY)
%
Mar F
1.50
April 20, 2017
1:00 PM
Germany
PMI Services
Value
Apr P
55.60
Apr 21, 2017
7:30 PM
Euro Zone
Euro-Zone Consumer Confidence
Value
Apr A
-5.00
1:00 PM
Germany
PMI Manufacturing
Value
Apr P
58.30
7:30 PM
US
Existing home sales
Million
Mar
5.48
5.55
Apr 25, 2017
7:30 PM
US
Consumer Confidence
S.A./ 1985=100
Apr
125.60
124.25
7:30 PM
US
New home sales
Thousands
Mar
592.00
595.00
Apr 27, 2017
5:15 PM
Euro Zone
ECB announces interest rates
%
Apr 27
-
Apr 28, 2017
6:00 PM
US
GDP Qoq (Annualised)
% Change
1Q A
2.10
2:00 PM
UK
GDP (YoY)
% Change
1Q A
1.90
Apr 30, 2017
6:30 AM
China
PMI Manufacturing
Value
Apr
51.80
May 02, 2017
1:25 PM
Germany
Unemployment change (000's)
Thousands
Apr
(30.00)
US
FOMC rate decision
%
May 3
1.00
1.00
Source: Bloomberg, Angel Research
Market Outlook
April 13, 2017
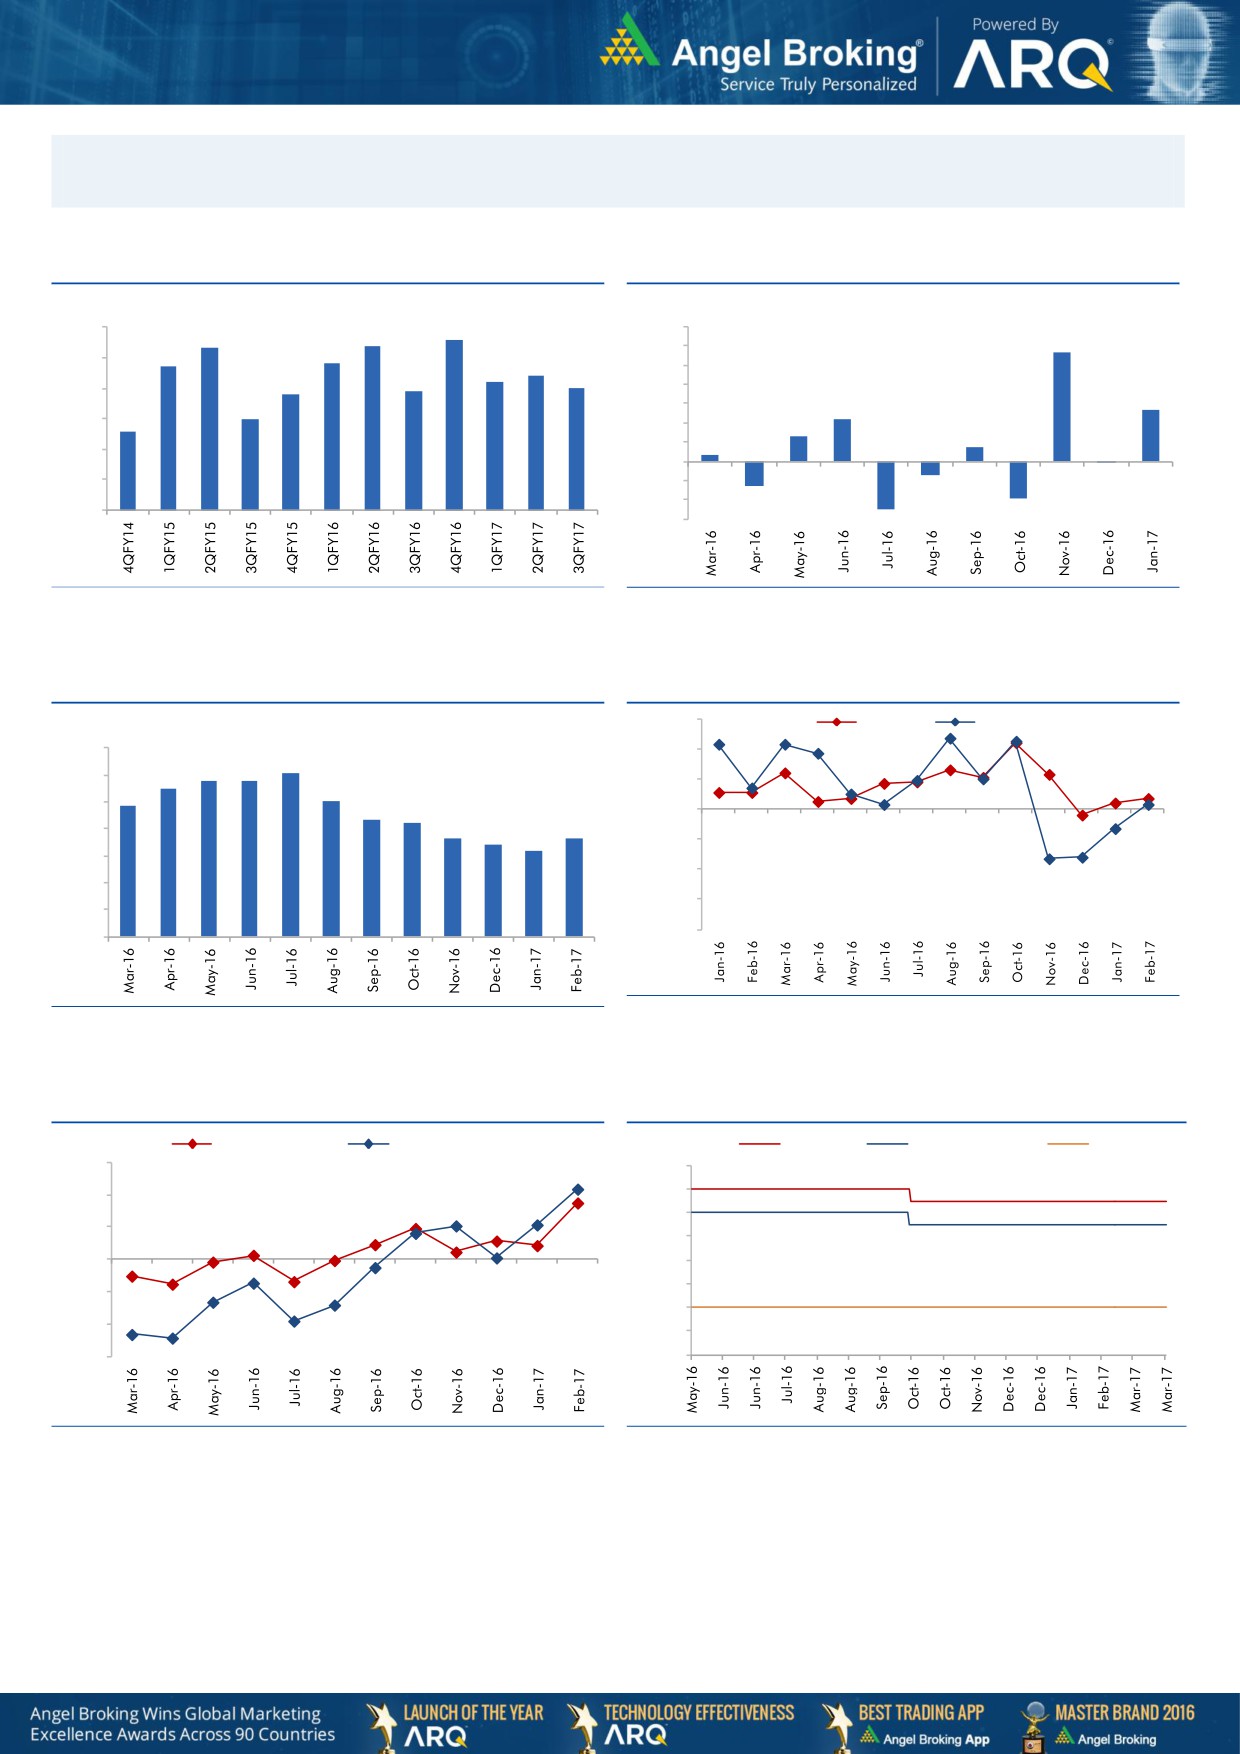
Macro watch
Exhibit 1: Quarterly GDP trends
Exhibit 2: IIP trends
(%)
(%)
8.6
9.0
8.4
7.0
8.3
5.7
7.7
7.8
6.0
8.0
7.4
7.2
5.0
6.9
7.0
6.8
7.0
4.0
2.7
6.0
3.0
2.2
6.0
5.6
1.3
2.0
0.7
1.0
0.3
5.0
-
4.0
(1.0)
(0.1)
(0.7)
(2.0)
3.0
(1.3)
(3.0)
(1.9)
(2.5)
Source: CSO, Angel Research
Source: MOSPI, Angel Research
Exhibit 3: Monthly CPI inflation trends
Exhibit 4: Manufacturing and services PMI
56.0
Mfg. PMI
Services PMI
(%)
7.0
54.0
6.1
5.8
5.8
6.0
5.5
5.1
52.0
4.8
5.0
4.3
4.2
50.0
3.6
3.7
4.0
3.4
3.2
48.0
3.0
46.0
2.0
44.0
1.0
42.0
-
Source: Market, Angel Research; Note: Level above 50 indicates expansion
Source: MOSPI, Angel Research
Exhibit 5: Exports and imports growth trends
Exhibit 6: Key policy rates
(%)
Exports yoy growth
Imports yoy growth
(%)
Repo rate
Reverse Repo rate
CRR
30.0
7.00
20.0
6.50
6.00
10.0
5.50
0.0
5.00
4.50
(10.0)
4.00
(20.0)
3.50
(30.0)
3.00
Source: Bloomberg, Angel Research
Source: RBI, Angel Research
Stock Watch
April 13, 2017
Company Name
Reco
CMP
Target
Mkt Cap
Sales ( Čcr )
OPM(%)
EPS (Č)
PER(x)
P/BV(x)
RoE(%)
EV/Sales(x)
(Č)
Price ( Č)
( Č cr )
FY17E
FY18E
FY17E
FY18E
FY17E
FY18E
FY17E
FY18E
FY17E
FY18E
FY17E
FY18E
FY17E
FY18E
6,577.0
6,907.0
Agri / Agri Chemical
Rallis
Neutral
252
-
4,908
1,937
2,164
13.3
14.3
9.0
11.0
28.0
23.0
4.9
4.3
18.4
19.8
2.6
2.3
United Phosphorus
Neutral
736
-
37,330
15,176
17,604
18.5
18.5
37.4
44.6
19.7
16.5
3.9
3.2
21.4
21.2
2.6
2.2
Auto & Auto Ancillary
Ashok Leyland
Buy
82
111
23,450
20,021
21,915
11.6
11.9
4.5
5.3
18.3
15.5
3.7
3.3
20.6
21.5
1.1
1.0
Bajaj Auto
Neutral
2,822
-
81,672
25,093
27,891
19.5
19.2
143.9
162.5
19.6
17.4
5.5
4.7
30.3
29.4
3.0
2.6
Bharat Forge
Neutral
1,097
-
25,540
7,726
8,713
20.5
21.2
35.3
42.7
31.1
25.7
5.7
5.2
18.9
20.1
3.4
2.9
Eicher Motors
Neutral
25,880
-
70,421
16,583
20,447
17.5
18.0
598.0
745.2
43.3
34.7
14.8
11.3
41.2
38.3
4.1
3.2
Gabriel India
Neutral
125
-
1,795
1,544
1,715
9.0
9.3
5.4
6.3
23.1
19.8
4.4
3.9
18.9
19.5
1.1
1.0
Hero Motocorp
Accumulate
3,201
3,446
63,930
28,083
30,096
15.3
15.7
171.8
187.0
18.6
17.1
6.5
5.5
30.1
27.9
2.1
1.9
Jamna Auto Industries Neutral
225
-
1,791
1,486
1,620
9.8
9.9
15.0
17.2
15.0
13.1
3.3
2.8
21.8
21.3
1.3
1.2
L G Balakrishnan & Bros Neutral
619
-
972
1,302
1,432
11.6
11.9
43.7
53.0
14.2
11.7
2.0
1.8
13.8
14.2
0.8
0.8
Mahindra and Mahindra Neutral
1,282
-
79,593
46,534
53,077
11.6
11.7
67.3
78.1
19.0
16.4
3.1
2.7
15.4
15.8
1.7
1.4
Maruti
Neutral
6,248
-
188,746
67,822
83,288
16.0
16.4
253.8
312.4
24.6
20.0
5.7
4.6
23.0
22.9
2.4
1.9
Minda Industries
Neutral
441
-
3,495
2,728
3,042
9.0
9.1
68.2
86.2
6.5
5.1
1.5
1.2
23.8
24.3
1.3
1.2
Motherson Sumi
Neutral
380
-
53,378
45,896
53,687
7.8
8.3
13.0
16.1
29.2
23.6
9.4
7.5
34.7
35.4
1.2
1.0
Rane Brake Lining
Neutral
1,008
-
798
511
562
11.3
11.5
28.1
30.9
35.9
32.6
5.5
5.0
15.3
15.0
1.7
1.6
Setco Automotive
Neutral
40
-
540
741
837
13.0
13.0
15.2
17.0
2.7
2.4
0.4
0.4
15.8
16.3
1.1
1.0
Tata Motors
Neutral
473
-
136,499
300,209
338,549
8.9
8.4
42.7
54.3
11.1
8.7
1.8
1.5
15.6
17.2
0.6
0.5
TVS Motor
Neutral
474
-
22,495
13,390
15,948
6.9
7.1
12.8
16.5
37.1
28.6
9.2
7.3
26.3
27.2
1.7
1.4
Amara Raja Batteries
Accumulate
881
1,009
15,043
5,305
6,100
16.0
16.3
28.4
34.0
31.0
25.9
6.0
5.0
19.3
19.3
2.8
2.5
Exide Industries
Neutral
233
-
19,792
7,439
8,307
15.0
15.0
8.1
9.3
28.8
25.0
4.0
3.6
14.3
16.7
2.3
2.0
Apollo Tyres
Neutral
229
-
11,641
12,877
14,504
14.3
13.9
21.4
23.0
10.7
10.0
1.7
1.4
16.4
15.2
1.1
1.0
Ceat
Neutral
1,464
-
5,920
7,524
8,624
13.0
12.7
131.1
144.3
11.2
10.1
2.1
1.7
19.8
18.6
0.9
0.8
JK Tyres
Neutral
144
-
3,270
7,455
8,056
15.0
15.0
21.8
24.5
6.6
5.9
1.4
1.1
22.8
21.3
0.6
0.5
Swaraj Engines
Neutral
1,500
-
1,863
660
810
15.2
16.4
54.5
72.8
27.5
20.6
8.6
7.8
31.5
39.2
2.6
2.1
Subros
Neutral
233
-
1,398
1,488
1,681
11.7
11.9
6.4
7.2
36.4
32.5
3.9
3.5
10.8
11.4
1.2
1.0
Indag Rubber
Neutral
211
-
555
286
326
19.8
16.8
11.7
13.3
18.1
15.9
3.1
2.9
17.8
17.1
1.6
1.4
Capital Goods
ACE
Neutral
68
-
675
709
814
4.1
4.6
1.4
2.1
48.8
32.5
2.0
1.9
4.4
6.0
1.1
1.0
Stock Watch
April 13, 2017
Company Name
Reco
CMP
Target
Mkt Cap
Sales ( Čcr )
OPM(%)
EPS (Č)
PER(x)
P/BV(x)
RoE(%)
EV/Sales(x)
(Č)
Price ( Č)
( Č cr )
FY17E
FY18E
FY17E
FY18E
FY17E
FY18E
FY17E
FY18E
FY17E
FY18E
FY17E
FY18E
FY17E
FY18E
Capital Goods
BEML
Neutral
1,378
-
5,738
3,451
4,055
6.3
9.2
31.4
57.9
43.9
23.8
2.6
2.4
6.3
10.9
1.8
1.5
Bharat Electronics
Neutral
177
-
39,446
8,137
9,169
16.8
17.2
58.7
62.5
3.0
2.8
0.5
0.4
44.6
46.3
3.8
3.4
Voltas
Neutral
414
-
13,685
6,511
7,514
7.9
8.7
12.9
16.3
32.1
25.4
5.8
5.1
16.7
18.5
1.9
1.6
BGR Energy
Neutral
173
-
1,249
16,567
33,848
6.0
5.6
7.8
5.9
22.2
29.4
1.3
1.2
4.7
4.2
0.2
0.1
BHEL
Neutral
176
-
43,188
28,797
34,742
-
2.8
2.3
6.9
76.7
25.6
1.3
1.3
1.3
4.8
1.2
0.8
Blue Star
Accumulate
670
760
6,403
4,283
5,077
5.9
7.3
14.9
22.1
45.0
30.3
8.7
7.4
20.4
26.4
1.5
1.3
CG Power and Industrial
Neutral
80
-
5,014
5,777
6,120
5.9
7.0
3.3
4.5
24.2
17.8
1.1
1.0
4.4
5.9
0.8
0.7
Solutions
Greaves Cotton
Neutral
170
-
4,147
1,755
1,881
16.8
16.9
7.8
8.5
21.8
20.0
4.4
4.0
20.6
20.9
2.1
1.9
Inox Wind
Neutral
189
-
4,202
5,605
6,267
15.7
16.4
24.8
30.0
7.6
6.3
2.1
1.6
25.9
24.4
0.8
0.7
KEC International
Neutral
213
-
5,486
9,294
10,186
7.9
8.1
9.9
11.9
21.6
17.9
3.2
2.7
15.6
16.3
0.8
0.7
KEI Industries
Neutral
198
-
1,539
2,682
3,058
10.4
10.0
11.7
12.8
16.9
15.5
3.4
2.8
20.1
18.2
0.8
0.7
Thermax
Neutral
991
-
11,806
5,421
5,940
7.3
7.3
25.7
30.2
38.6
32.8
4.7
4.3
12.2
13.1
2.1
1.9
VATech Wabag
Neutral
679
-
3,704
3,136
3,845
8.9
9.1
26.0
35.9
26.1
18.9
3.3
2.8
13.4
15.9
1.1
0.9
Cement
ACC
Neutral
1,486
-
27,897
11,225
13,172
13.2
16.9
44.5
75.5
33.4
19.7
3.2
2.9
11.2
14.2
2.5
2.1
Ambuja Cements
Neutral
248
-
49,274
9,350
10,979
18.2
22.5
5.8
9.5
42.8
26.1
3.6
3.2
10.2
12.5
5.3
4.5
India Cements
Neutral
168
-
5,174
4,364
4,997
18.5
19.2
7.9
11.3
21.3
14.9
1.5
1.5
8.0
8.5
1.9
1.7
JK Cement
Neutral
945
-
6,603
4,398
5,173
15.5
17.5
31.2
55.5
30.3
17.0
3.6
3.2
12.0
15.5
2.1
1.7
J K Lakshmi Cement
Neutral
461
-
5,425
2,913
3,412
14.5
19.5
7.5
22.5
61.5
20.5
3.8
3.2
12.5
18.0
2.5
2.0
Orient Cement
Neutral
147
-
3,003
2,114
2,558
18.5
20.5
8.1
11.3
18.1
13.0
2.7
2.3
9.0
14.0
2.0
1.6
UltraTech Cement
Neutral
4,034
-
110,741
25,768
30,385
21.0
23.5
111.0
160.0
36.3
25.2
4.6
4.1
13.5
15.8
4.4
3.7
Construction
ITNL
Neutral
113
-
3,727
8,946
10,017
31.0
31.6
8.1
9.1
14.0
12.5
0.5
0.5
4.2
5.0
3.7
3.5
KNR Constructions
Neutral
196
-
2,750
1,385
1,673
14.7
14.0
41.2
48.5
4.8
4.0
0.9
0.8
14.9
15.2
2.1
1.7
Larsen & Toubro
Neutral
1,705
-
159,052
111,017
124,908
11.0
11.0
61.1
66.7
27.9
25.6
3.4
3.1
13.1
12.9
2.5
2.3
Gujarat Pipavav Port
Neutral
161
-
7,766
705
788
52.2
51.7
5.0
5.6
32.1
28.7
3.2
2.8
11.2
11.2
10.7
9.1
Nagarjuna Const.
Neutral
89
-
4,967
8,842
9,775
9.1
8.8
5.3
6.4
16.9
14.0
1.3
1.2
8.2
9.1
0.7
0.6
PNC Infratech
Accumulate
131
143
3,372
2,350
2,904
13.1
13.2
9.0
8.8
14.6
14.9
0.5
0.5
15.9
13.9
1.6
1.3
Simplex Infra
Neutral
386
-
1,909
6,829
7,954
10.5
10.5
31.4
37.4
12.3
10.3
1.3
1.2
9.9
13.4
0.7
0.6
Power Mech Projects
Neutral
526
-
774
1,801
2,219
12.7
14.6
72.1
113.9
7.3
4.6
1.3
1.1
16.8
11.9
0.4
0.3
Sadbhav Engineering
Neutral
334
-
5,732
3,598
4,140
10.3
10.6
9.0
11.9
37.1
28.1
3.9
3.4
9.9
11.9
1.9
1.6
Stock Watch
April 13, 2017
Company Name
Reco
CMP
Target
Mkt Cap
Sales ( Čcr )
OPM(%)
EPS (Č)
PER(x)
P/BV(x)
RoE(%)
EV/Sales(x)
(Č)
Price ( Č)
( Č cr )
FY17E
FY18E
FY17E
FY18E
FY17E
FY18E
FY17E
FY18E
FY17E
FY18E
FY17E
FY18E
FY17E
FY18E
Construction
NBCC
Neutral
181
-
16,326
7,428
9,549
7.9
8.6
8.2
11.0
22.1
16.5
1.1
0.9
28.2
28.7
1.9
1.4
MEP Infra
Neutral
69
-
1,114
1,877
1,943
30.6
29.8
3.0
4.2
22.8
16.3
11.1
7.5
0.6
0.6
2.0
1.8
SIPL
Neutral
103
-
3,619
1,036
1,252
65.5
66.2
(8.4)
(5.6)
3.9
4.4
(22.8)
(15.9)
11.7
9.7
Engineers India
Neutral
154
-
10,405
1,725
1,935
16.0
19.1
11.4
13.9
13.5
11.1
1.9
1.8
13.4
15.3
5.0
4.4
Financials
Axis Bank
Accumulate
514
580
123,021
46,932
53,575
3.5
3.4
32.4
44.6
15.9
11.5
2.0
1.8
13.6
16.5
-
-
Bank of Baroda
Neutral
175
-
40,208
19,980
23,178
1.8
1.8
11.5
17.3
15.2
10.1
1.7
1.4
8.3
10.1
-
-
Canara Bank
Neutral
315
-
17,107
15,225
16,836
1.8
1.8
14.5
28.0
21.7
11.3
1.5
1.2
5.8
8.5
-
-
Can Fin Homes
Neutral
2,369
-
6,307
420
526
3.5
3.5
86.5
107.8
27.4
22.0
5.9
4.8
23.6
24.1
-
-
Cholamandalam Inv. &
Accumulate
1,078
1,230
16,852
2,012
2,317
6.3
6.3
42.7
53.6
25.3
20.1
4.0
3.4
16.9
18.3
-
-
Fin. Co.
Dewan Housing Finance Buy
393
460
12,301
2,225
2,688
2.9
2.9
29.7
34.6
13.2
11.4
2.1
1.4
16.1
14.8
-
-
Equitas Holdings
Buy
165
235
5,574
939
1,281
11.7
11.5
5.8
8.2
28.5
20.1
2.5
2.2
10.9
11.5
-
-
Federal Bank
Neutral
92
-
15,826
8,259
8,995
3.0
3.0
4.3
5.6
21.4
16.4
1.8
1.7
8.5
10.1
-
-
HDFC
Neutral
1,476
-
234,424
11,475
13,450
3.4
3.4
45.3
52.5
32.6
28.1
6.3
5.6
20.2
20.5
-
-
HDFC Bank
Neutral
1,439
-
368,763
46,097
55,433
4.5
4.5
58.4
68.0
24.6
21.2
4.3
3.6
18.8
18.6
-
-
ICICI Bank
Accumulate
283
315
164,793
42,800
44,686
3.1
3.3
18.0
21.9
15.7
12.9
2.1
2.0
11.1
12.3
-
-
Karur Vysya Bank
Buy
121
140
7,324
5,640
6,030
3.3
3.2
8.9
10.0
13.6
12.1
1.4
1.3
11.2
11.4
-
-
Lakshmi Vilas Bank
Neutral
172
-
3,285
3,339
3,799
2.7
2.8
11.0
14.0
15.6
12.3
1.6
1.5
11.2
12.7
-
-
LIC Housing Finance
Neutral
624
-
31,486
3,712
4,293
2.6
2.5
39.0
46.0
16.0
13.6
3.0
2.6
19.9
20.1
-
-
Punjab Natl.Bank
Neutral
158
-
33,664
23,532
23,595
2.3
2.4
6.8
12.6
23.3
12.6
3.6
2.6
3.3
6.5
-
-
RBL Bank
Neutral
575
-
21,257
1,783
2,309
2.6
2.6
12.7
16.4
45.3
35.1
4.9
4.4
12.8
13.3
-
-
Repco Home Finance
Buy
698
825
4,370
388
457
4.5
4.2
30.0
38.0
23.3
18.4
3.9
3.3
18.0
19.2
-
-
South Ind.Bank
Neutral
23
-
4,056
6,435
7,578
2.5
2.5
2.7
3.1
8.3
7.3
1.1
0.9
10.1
11.2
-
-
St Bk of India
Neutral
294
-
234,182
88,650
98,335
2.6
2.6
13.5
18.8
21.8
15.6
2.1
1.8
7.0
8.5
-
-
Union Bank
Neutral
159
-
10,923
13,450
14,925
2.3
2.3
25.5
34.5
6.2
4.6
0.9
0.8
7.5
10.2
-
-
Yes Bank
Neutral
1,614
-
73,668
8,978
11,281
3.3
3.4
74.0
90.0
21.8
17.9
4.1
3.5
17.0
17.2
-
-
FMCG
Akzo Nobel India
Neutral
1,889
-
9,061
2,955
3,309
13.3
13.7
57.2
69.3
33.1
27.3
10.8
9.1
32.7
33.3
2.9
2.5
Asian Paints
Neutral
1,073
-
102,908
17,128
18,978
16.8
16.4
19.1
20.7
56.2
51.8
19.5
18.4
34.8
35.5
5.9
5.3
Britannia
Accumulate
3,395
3,626
40,736
9,594
11,011
14.6
14.9
80.3
94.0
42.3
36.1
17.4
13.4
41.2
-
4.1
3.5
Colgate
Neutral
1,019
-
27,726
4,605
5,149
23.4
23.4
23.8
26.9
42.8
37.9
23.7
18.5
64.8
66.8
5.9
5.3
Stock Watch
April 13, 2017
Company Name
Reco
CMP
Target
Mkt Cap
Sales ( Čcr )
OPM(%)
EPS (Č)
PER(x)
P/BV(x)
RoE(%)
EV/Sales(x)
(Č)
Price ( Č)
( Č cr )
FY17E FY18E
FY17E
FY18E
FY17E
FY18E
FY17E
FY18E
FY17E
FY18E
FY17E
FY18E
FY17E
FY18E
FMCG
Dabur India
Accumulate
289
304
50,952
8,315
9,405
19.8
20.7
8.1
9.2
35.7
31.4
9.9
8.2
31.6
31.0
5.8
5.1
GlaxoSmith Con*
Neutral
5,205
-
21,890
4,350
4,823
21.2
21.4
179.2
196.5
29.1
26.5
7.7
6.5
27.1
26.8
4.4
3.9
Godrej Consumer
Neutral
1,680
-
57,212
10,235
11,428
18.4
18.6
41.1
44.2
40.9
38.0
9.1
7.7
24.9
24.8
5.7
5.0
HUL
Neutral
923
-
199,834
35,252
38,495
17.8
17.8
20.7
22.4
44.7
41.2
42.7
36.7
95.6
88.9
5.5
5.0
ITC
Neutral
282
-
342,738
40,059
44,439
38.3
39.2
9.0
10.1
31.4
27.8
8.8
7.7
27.8
27.5
8.1
7.3
Marico
Neutral
302
-
38,921
6,430
7,349
18.8
19.5
6.4
7.7
47.1
39.2
14.2
12.0
33.2
32.5
5.9
5.1
Nestle*
Neutral
6,565
-
63,297
10,073
11,807
20.7
21.5
124.8
154.2
52.6
42.6
21.6
19.4
34.8
36.7
6.1
5.2
Tata Global
Neutral
153
-
9,682
8,675
9,088
9.8
9.8
7.4
8.2
20.7
18.7
1.6
1.6
7.9
8.1
1.0
1.0
Procter & Gamble
Neutral
7,343
-
23,837
2,939
3,342
23.2
23.0
146.2
163.7
50.2
44.9
12.7
10.6
25.3
23.5
7.7
6.7
Hygiene
IT
HCL Tech^
Buy
834
1,000
117,646
49,242
57,168
20.5
20.5
55.7
64.1
15.0
13.0
3.0
2.3
20.3
17.9
2.3
1.8
Infosys
Buy
967
1,249
222,149
68,350
77,326
27.0
27.0
62.5
69.4
15.5
13.9
3.3
3.0
21.3
21.6
2.7
2.3
TCS
Accumulate
2,421
2,700
477,001
119,025
133,308
27.6
27.6
131.2
145.5
18.5
16.6
6.0
5.5
32.4
33.1
3.8
3.3
Tech Mahindra
Buy
445
600
43,318
29,673
32,937
15.5
17.0
32.8
39.9
13.6
11.2
2.7
2.3
19.6
20.7
1.2
1.0
Wipro
Accumulate
510
583
123,964
55,440
60,430
18.1
18.1
36.1
38.9
14.1
13.1
2.5
2.3
19.0
17.6
2.0
1.7
Media
D B Corp
Neutral
382
-
7,017
2,297
2,590
27.4
28.2
21.0
23.4
18.2
16.3
4.2
3.7
23.7
23.1
2.9
2.5
HT Media
Neutral
87
-
2,016
2,693
2,991
12.6
12.9
7.9
9.0
11.0
9.6
0.9
0.9
7.8
8.3
0.3
0.2
Jagran Prakashan
Buy
192
225
6,264
2,355
2,635
28.0
28.0
10.8
12.5
17.7
15.3
3.9
3.3
21.7
21.7
2.7
2.3
Sun TV Network
Neutral
794
-
31,278
2,850
3,265
70.1
71.0
26.2
30.4
30.3
26.1
7.8
6.8
24.3
25.6
10.6
9.1
Hindustan Media
Neutral
284
-
2,081
1,016
1,138
24.3
25.2
27.3
30.1
10.4
9.4
2.0
1.8
16.2
15.8
1.4
1.2
Ventures
TV Today Network
Buy
285
344
1,701
567
645
26.7
27.0
15.4
18.1
18.6
15.8
2.8
2.4
14.9
15.2
2.6
2.2
Metals & Mining
Coal India
Neutral
289
-
179,518
84,638
94,297
21.4
22.3
24.5
27.1
11.8
10.7
4.9
4.7
42.6
46.0
1.6
1.5
Hind. Zinc
Neutral
284
-
119,978
14,252
18,465
55.9
48.3
15.8
21.5
18.0
13.2
2.9
2.6
17.0
20.7
8.4
6.5
Hindalco
Neutral
197
-
44,080
107,899
112,095
7.4
8.2
9.2
13.0
21.4
15.1
1.0
1.0
4.8
6.6
0.9
0.9
JSW Steel
Neutral
199
-
48,030
53,201
58,779
16.1
16.2
130.6
153.7
1.5
1.3
0.2
0.2
14.0
14.4
1.7
1.4
NMDC
Neutral
135
-
42,823
6,643
7,284
44.4
47.7
7.1
7.7
19.1
17.6
1.7
1.6
8.8
9.2
4.2
3.8
SAIL
Neutral
66
-
27,114
47,528
53,738
(0.7)
2.1
(1.9)
2.6
25.3
0.7
0.7
(1.6)
3.9
1.4
1.3
Vedanta
Neutral
253
-
74,933
71,744
81,944
19.2
21.7
13.4
20.1
18.9
12.6
1.6
1.5
8.4
11.3
1.4
1.1
Tata Steel
Neutral
488
-
47,424
121,374
121,856
7.2
8.4
18.6
34.3
26.3
14.2
1.6
1.5
6.1
10.1
1.0
1.0
Oil & Gas
Cairn India
Neutral
304
-
57,008
9,127
10,632
4.3
20.6
8.8
11.7
34.5
26.0
1.1
1.1
3.3
4.2
7.7
6.4
Stock Watch
April 13, 2017
Company Name
Reco
CMP
Target
Mkt Cap
Sales ( Čcr )
OPM(%)
EPS (Č)
PER(x)
P/BV(x)
RoE(%)
EV/Sales(x)
(Č)
Price ( Č)
( Č cr )
FY17E FY18E
FY17E
FY18E
FY17E
FY18E
FY17E
FY18E
FY17E
FY18E
FY17E
FY18E
FY17E
FY18E
Oil & Gas
GAIL
Neutral
385
-
65,064
56,220
65,198
9.3
10.1
27.1
33.3
14.2
11.6
1.3
1.2
9.3
10.7
1.3
1.1
ONGC
Neutral
188
-
240,623
137,222
152,563
15.0
21.8
19.5
24.1
9.6
7.8
0.8
0.8
8.5
10.1
2.0
1.8
Indian Oil Corp
Neutral
410
-
198,849
373,359
428,656
5.9
5.5
54.0
59.3
7.6
6.9
1.2
1.1
16.0
15.6
0.7
0.6
Reliance Industries
Neutral
1,374
-
446,758
301,963
358,039
12.1
12.6
87.7
101.7
15.7
13.5
1.6
1.5
10.7
11.3
2.0
1.6
Pharmaceuticals
Alembic Pharma
Accumulate
628
689
11,831
3,483
4,244
20.2
21.4
24.3
33.6
25.8
18.7
5.9
4.7
25.5
25.3
3.3
2.7
Alkem Laboratories Ltd
Accumulate
2,127
2,257
25,433
6,065
7,009
18.7
20.0
80.2
92.0
26.5
23.1
6.0
5.0
22.5
21.6
4.1
3.6
Aurobindo Pharma
Buy
656
877
38,440
15,720
18,078
23.7
23.7
41.4
47.3
15.9
13.9
4.1
3.2
29.6
26.1
2.7
2.3
Aventis*
Neutral
4,608
-
10,612
2,277
2,597
16.6
17.4
128.9
157.0
35.8
29.4
6.1
4.7
21.6
26.4
4.4
3.7
Cadila Healthcare
Neutral
459
-
46,959
10,429
12,318
17.7
21.6
13.1
19.2
35.0
23.9
7.3
5.8
22.8
27.1
4.5
3.7
Cipla
Sell
579
465
46,565
15,378
18,089
15.7
16.8
19.3
24.5
30.0
23.6
3.5
3.1
12.3
13.9
3.2
2.7
Dr Reddy's
Neutral
2,630
-
43,576
16,043
18,119
18.0
23.0
78.6
130.9
33.5
20.1
3.3
2.9
10.1
15.2
2.5
2.4
Dishman Pharma
Sell
324
143
5,231
1,718
1,890
22.7
22.8
9.5
11.3
34.1
28.7
3.3
3.0
10.1
10.9
3.5
3.1
GSK Pharma*
Neutral
2,709
-
22,949
2,800
3,290
10.2
20.6
32.2
60.3
84.1
44.9
15.6
15.4
17.2
34.5
8.0
6.8
Indoco Remedies
Neutral
235
-
2,165
1,112
1,289
16.2
18.2
11.6
16.0
20.3
14.7
3.2
2.7
17.0
20.1
2.1
1.7
Ipca labs
Neutral
632
-
7,980
3,258
3,747
12.8
15.3
12.1
19.2
52.3
32.9
3.3
3.0
6.4
9.5
2.6
2.2
Lupin
Buy
1,429
1,809
64,508
15,912
18,644
26.4
26.7
58.1
69.3
24.6
20.6
4.8
3.9
21.4
20.9
4.1
3.4
Sun Pharma
Buy
671
847
160,880
31,129
35,258
32.0
32.9
30.2
35.3
22.2
19.0
3.6
3.0
20.0
20.1
4.7
4.0
Power
Tata Power
Neutral
85
-
23,112
36,916
39,557
17.4
27.1
5.1
6.3
16.8
13.6
1.5
1.4
9.0
10.3
1.6
1.5
NTPC
Neutral
167
-
137,823
86,605
95,545
17.5
20.8
11.8
13.4
14.2
12.5
1.4
1.3
10.5
11.1
2.9
2.9
Power Grid
Accumulate
199
223
104,344
25,315
29,193
88.2
88.7
14.2
17.2
14.1
11.6
2.1
1.9
15.2
16.1
8.8
7.9
Real Estate
Prestige Estate
Neutral
219
-
8,220
4,707
5,105
25.2
26.0
10.3
13.0
21.3
16.9
1.7
1.6
10.3
10.2
2.9
2.6
MLIFE
Buy
411
522
1,686
1,152
1,300
22.7
24.6
29.9
35.8
13.7
11.5
1.0
1.0
7.6
8.6
2.2
1.8
Telecom
Bharti Airtel
Neutral
350
-
139,989
105,086
114,808
34.5
34.7
12.2
16.4
28.7
21.4
1.9
1.8
6.8
8.4
2.2
2.0
Idea Cellular
Neutral
88
-
31,871
40,133
43,731
37.2
37.1
6.4
6.5
13.8
13.6
1.2
1.1
8.2
7.6
1.8
1.5
zOthers
Abbott India
Neutral
4,710
-
10,009
3,153
3,583
14.1
14.4
152.2
182.7
31.0
25.8
152.0
129.8
25.6
26.1
2.9
2.5
Asian Granito
Accumulate
386
405
1,160
1,060
1,169
12.2
12.5
12.7
15.9
30.5
24.3
2.9
2.6
9.5
10.7
1.4
1.2
Bajaj Electricals
Accumulate
347
395
3,513
4,801
5,351
5.7
6.2
10.4
13.7
33.3
25.4
4.1
3.7
12.4
14.5
0.7
0.7
Banco Products (India)
Neutral
221
-
1,582
1,353
1,471
12.3
12.4
14.5
16.3
15.3
13.6
21.1
19.0
14.5
14.6
1.1
119.2
Coffee Day Enterprises
Neutral
233
-
4,808
2,964
3,260
20.5
21.2
4.7
8.0
-
29.2
2.7
2.5
5.5
8.5
2.0
1.8
Ltd
Stock Watch
April 13, 2017
Company Name
Reco
CMP
Target
Mkt Cap
Sales ( Čcr )
OPM(%)
EPS (Č)
PER(x)
P/BV(x)
RoE(%)
EV/Sales(x)
(Č)
Price ( Č)
( Č cr )
FY17E
FY18E
FY17E
FY18E
FY17E
FY18E
FY17E
FY18E
FY17E
FY18E
FY17E
FY18E
FY17E
FY18E
zOthers
Competent Automobiles Neutral
236
-
145
1,137
1,256
3.1
2.7
28.0
23.6
8.4
10.0
45.4
41.0
14.3
11.5
0.1
0.1
Elecon Engineering
Neutral
59
-
663
1,482
1,660
13.7
14.5
3.9
5.8
15.1
10.2
3.6
3.3
7.8
10.9
0.8
0.7
Finolex Cables
Neutral
551
-
8,426
2,883
3,115
12.0
12.1
14.2
18.6
38.8
29.6
20.6
18.0
15.8
14.6
2.6
2.4
Garware Wall Ropes
Neutral
678
-
1,483
863
928
15.1
15.2
36.4
39.4
18.6
17.2
3.4
2.9
17.5
15.9
1.6
1.5
Goodyear India*
Neutral
901
-
2,079
1,598
1,704
10.4
10.2
49.4
52.6
18.2
17.1
84.2
73.9
18.2
17.0
1.0
140.9
Hitachi
Neutral
1,873
-
5,092
2,081
2,433
8.8
8.9
33.4
39.9
56.1
46.9
45.2
37.7
22.1
21.4
2.4
2.1
HSIL
Neutral
363
-
2,625
2,384
2,515
15.8
16.3
15.3
19.4
23.7
18.7
23.6
20.3
7.8
9.3
1.3
1.2
Interglobe Aviation
Neutral
1,093
-
39,499
21,122
26,005
14.5
27.6
110.7
132.1
9.9
8.3
59.1
42.2
168.5
201.1
1.8
1.5
Jyothy Laboratories
Neutral
362
-
6,577
1,440
2,052
11.5
13.0
8.5
10.0
42.6
36.2
10.3
9.6
18.6
19.3
4.8
3.4
Kirloskar Engines India
Neutral
393
-
5,677
2,554
2,800
9.9
10.0
10.5
12.1
37.4
32.4
15.6
14.8
10.7
11.7
1.9
1.7
Ltd
Linc Pen & Plastics
Neutral
296
-
438
382
420
9.3
9.5
13.5
15.7
22.0
18.9
3.8
3.3
17.1
17.3
1.2
1.1
M M Forgings
Neutral
565
-
682
546
608
20.4
20.7
41.3
48.7
13.7
11.6
77.4
68.5
16.6
17.0
1.1
1.0
Manpasand Bever.
Neutral
715
-
4,093
836
1,087
19.6
19.4
16.9
23.8
42.3
30.0
5.1
4.4
12.0
14.8
4.6
3.5
Mirza International
Buy
87
107
1,043
963
1,069
17.2
18.0
6.1
7.5
14.2
11.6
2.2
1.8
15.0
15.7
1.3
1.2
MT Educare
Neutral
82
-
326
366
417
17.7
18.2
9.4
10.8
8.7
7.6
1.9
1.7
22.2
22.3
0.8
0.7
Narayana Hrudaya
Neutral
322
-
6,583
1,873
2,166
11.5
11.7
2.6
4.0
121.8
81.3
7.5
6.8
6.1
8.3
3.6
3.1
Navkar Corporation
Buy
209
265
2,974
369
561
42.9
42.3
6.9
11.5
30.2
18.1
2.1
1.9
7.4
10.5
9.1
6.0
Navneet Education
Neutral
160
-
3,743
1,062
1,147
24.0
24.0
6.1
6.6
26.3
24.2
5.4
4.8
20.6
19.8
3.6
3.3
Nilkamal
Neutral
1,974
-
2,946
1,995
2,165
10.7
10.4
69.8
80.6
28.3
24.5
112.8
98.0
16.6
16.5
1.5
1.3
Page Industries
Neutral
14,213
-
15,853
2,450
3,124
20.1
17.6
299.0
310.0
47.5
45.9
316.6
241.6
47.1
87.5
6.5
5.1
Parag Milk Foods
Neutral
252
-
2,116
1,919
2,231
9.3
9.6
9.5
12.9
26.6
19.5
4.1
3.4
15.5
17.5
1.3
1.1
Quick Heal
Neutral
255
-
1,786
408
495
27.3
27.0
7.7
8.8
32.9
29.0
3.1
3.1
9.3
10.6
3.5
2.9
Radico Khaitan
Buy
116
147
1,538
1,667
1,824
13.0
13.2
6.7
8.2
17.4
14.1
1.6
1.4
9.0
10.2
1.3
1.2
Relaxo Footwears
Neutral
490
-
5,885
2,085
2,469
9.2
8.2
7.6
8.0
64.8
61.6
25.1
21.4
17.9
18.8
2.9
2.5
S H Kelkar & Co.
Neutral
308
-
4,453
1,036
1,160
15.1
15.0
6.1
7.2
50.4
42.9
5.4
4.9
10.7
11.5
4.2
3.7
Siyaram Silk Mills
Accumulate
1,702
1,872
1,595
1,652
1,857
11.6
11.7
92.4
110.1
18.4
15.5
2.7
2.4
14.7
15.2
1.2
1.0
Styrolution ABS India*
Neutral
746
-
1,312
1,440
1,537
9.2
9.0
40.6
42.6
18.4
17.5
46.9
42.7
12.3
11.6
0.9
0.8
Surya Roshni
Neutral
211
-
924
3,342
3,625
7.8
7.5
17.3
19.8
12.2
10.7
23.2
18.6
10.5
10.8
0.5
0.5
Team Lease Serv.
Neutral
1,054
-
1,802
3,229
4,001
1.5
1.8
22.8
32.8
46.3
32.1
5.0
4.3
10.7
13.4
0.5
0.4
Stock Watch
April 13, 2017
Company Name
Reco
CMP
Target Mkt Cap
Sales ( Čcr )
OPM(%)
EPS (Č)
PER(x)
P/BV(x)
RoE(%)
EV/Sales(x)
(Č)
Price ( Č)
( Č cr )
FY17E FY18E FY17E FY18E FY17E FY18E FY17E FY18E FY17E FY18E FY17E FY18E FY17E FY18E
zOthers
The Byke Hospitality
Neutral
199
-
797
287
384
20.5
20.5
7.6
10.7
26.2
18.6
5.5
4.4
20.7
23.5
2.8
2.1
Transport Corporation of
Neutral
236
-
1,810
2,671
2,911
8.5
8.8
13.9
15.7
17.1
15.1
2.3
2.1
13.7
13.8
0.8
0.7
India
TVS Srichakra
Neutral
3,711
-
2,841
2,304
2,614
13.7
13.8
231.1
266.6
16.1
13.9
417.0
328.3
33.9
29.3
1.2
1.1
UFO Moviez
Neutral
469
-
1,295
619
685
33.2
33.4
30.0
34.9
15.7
13.5
2.2
1.9
13.8
13.9
1.8
1.4
Visaka Industries
Neutral
307
-
487
1,051
1,138
10.3
10.4
21.0
23.1
14.6
13.3
39.3
36.8
9.0
9.2
0.7
0.7
VRL Logistics
Neutral
347
-
3,163
1,902
2,119
16.7
16.6
14.6
16.8
23.8
20.6
5.2
4.6
21.9
22.2
1.8
1.6
VIP Industries
Neutral
198
-
2,800
1,270
1,450
10.4
10.4
5.6
6.5
35.4
30.5
7.3
6.4
20.7
21.1
2.2
1.9
Navin Fluorine
Buy
3,165
3,650
3,099
789
945
21.1
22.4
120.1
143.4
26.4
22.1
4.2
3.7
17.8
18.5
3.9
3.1
Source: Company, Angel Research; Note: *December year end; #September year end; &October year end; Price as on April 12, 2017
Market Outlook
April 13, 2017
Research Team Tel: 022 - 39357800
DISCLAIMER
Angel Broking Private Limited (hereinafter referred to as “Angel”) is a registered Member of National Stock Exchange of India
Limited,Bombay Stock Exchange Limited and Metropolitan Stock Exchange Limited. It is also registered as a Depository Participant with
CDSL and Portfolio Manager with SEBI. It also has registration with AMFI as a Mutual Fund Distributor. Angel Broking Private Limited is a
registered entity with SEBI for Research Analyst in terms of SEBI (Research Analyst) Regulations, 2014 vide registration number
INH000000164. Angel or its associates has not been debarred/ suspended by SEBI or any other regulatory authority for accessing
/dealing in securities Market. Angel or its associates/analyst has not received any compensation / managed or
co-managed public offering of securities of the company covered by Analyst during the past twelve months.
This document is solely for the personal information of the recipient, and must not be singularly used as the basis of any investment
decision. Nothing in this document should be construed as investment or financial advice. Each recipient of this document should make
such investigations as they deem necessary to arrive at an independent evaluation of an investment in the securities of the companies
referred to in this document (including the merits and risks involved), and should consult their own advisors to determine the merits and
risks of such an investment.
Reports based on technical and derivative analysis center on studying charts of a stock's price movement, outstanding positions and
trading volume, as opposed to focusing on a company's fundamentals and, as such, may not match with a report on a company's
fundamentals. Investors are advised to refer the Fundamental and Technical Research Reports available on our website to evaluate the
contrary view, if any.
The information in this document has been printed on the basis of publicly available information, internal data and other reliable
sources believed to be true, but we do not represent that it is accurate or complete and it should not be relied on as such, as this
document is for general guidance only. Angel Broking Pvt. Limited or any of its affiliates/ group companies shall not be in any way
responsible for any loss or damage that may arise to any person from any inadvertent error in the information contained in this report.
Angel Broking Pvt. Limited has not independently verified all the information contained within this document. Accordingly, we cannot
testify, nor make any representation or warranty, express or implied, to the accuracy, contents or data contained within this document.
While Angel Broking Pvt. Limited endeavors to update on a reasonable basis the information discussed in this material, there may be
regulatory, compliance, or other reasons that prevent us from doing so.
This document is being supplied to you solely for your information, and its contents, information or data may not be reproduced,
redistributed or passed on, directly or indirectly.
Neither Angel Broking Pvt. Limited, nor its directors, employees or affiliates shall be liable for any loss or damage that may arise from
or in connection with the use of this information.